


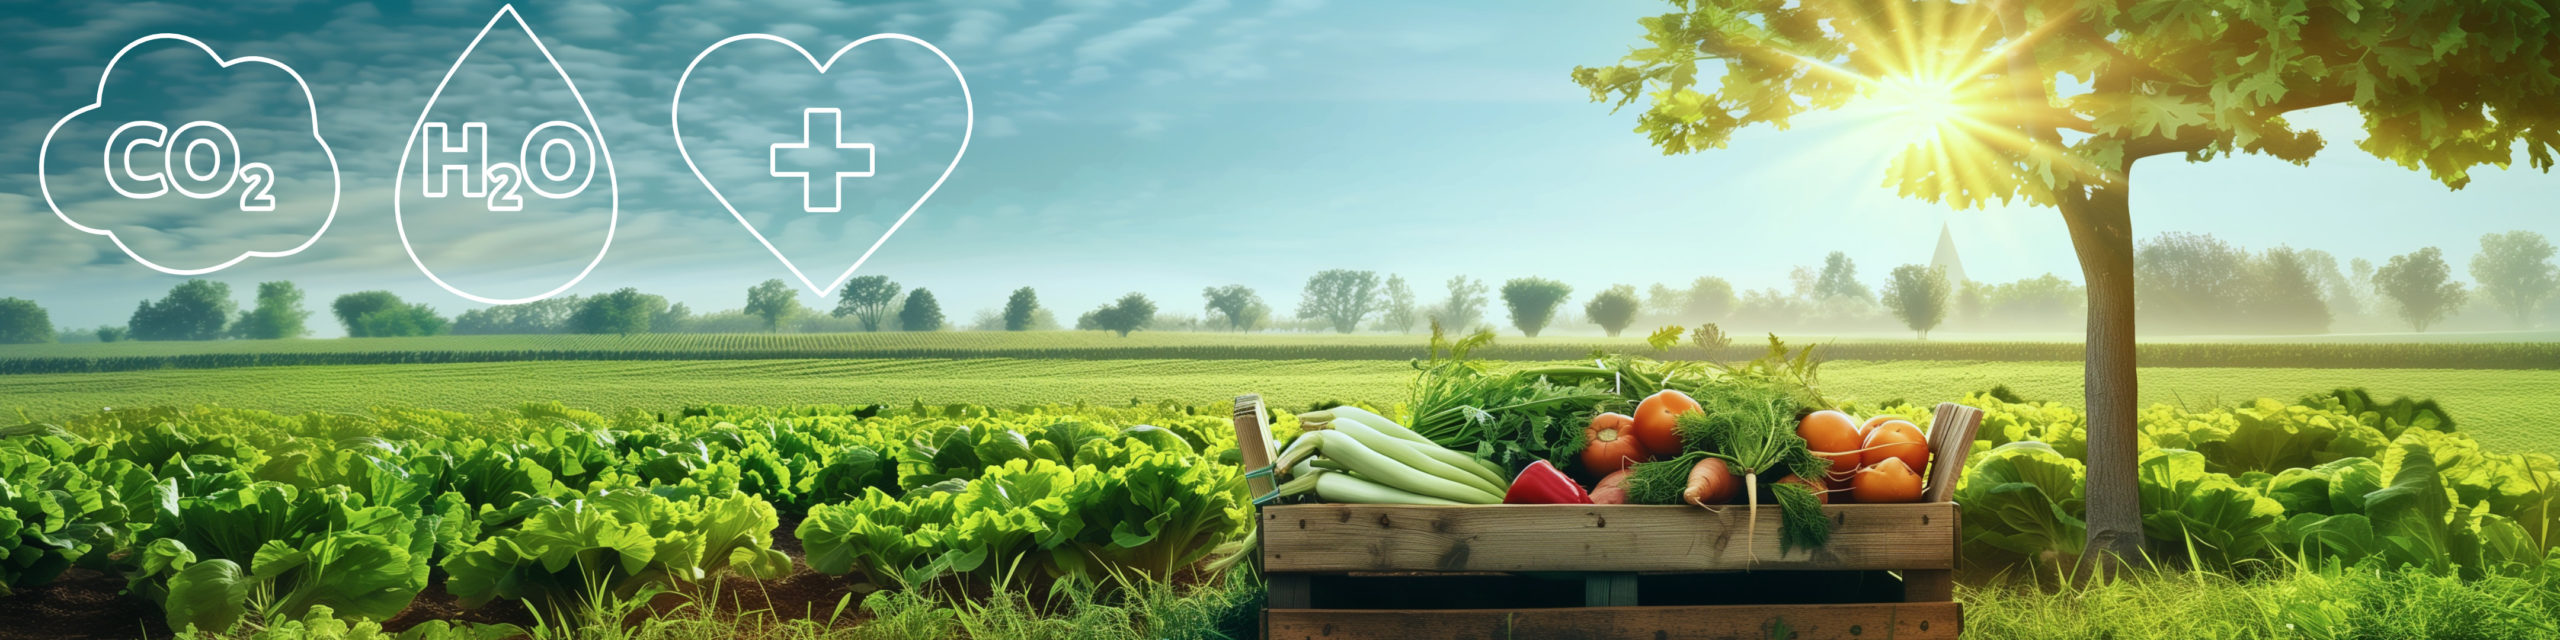
Climate-conscious and healthy eating in our canteens
Our food supply is responsible for around a third of global greenhouse gas emissions[1]. In order to enable our canteen guests to make an informed decision about the conscious and climate-friendly choice of their food, we are working with Eaternity climate and health labels. Our aim is to reduce greenhouse gas (GHG) emissions, minimize water consumption and promote a balanced diet through conscious menu design.
1. climate assessment: CO₂ footprint and daily food unit (saturation index)
The climate rating symbol – represented as a scale from A to E in the form of small clouds – shows how climate-friendly a dish is. It is based on two factors calculated together: the CO₂ footprint and the Daily Food Unit (satiety index) of the dish developed by the manufacturer Eaternity.
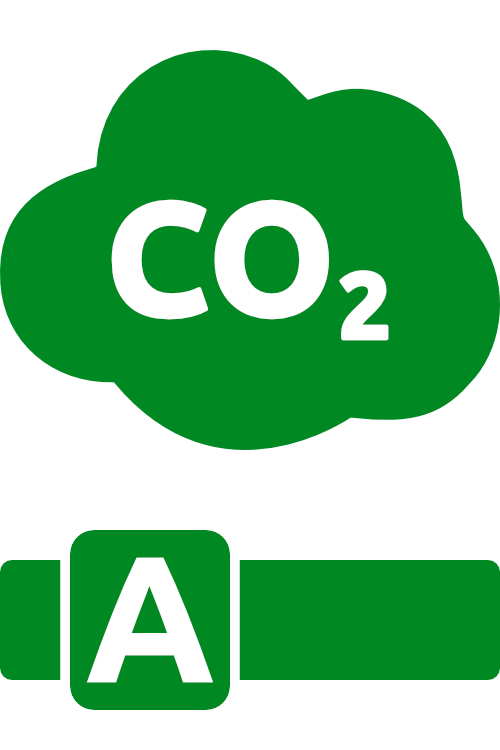
at least 50 % better than average – very climate-friendly
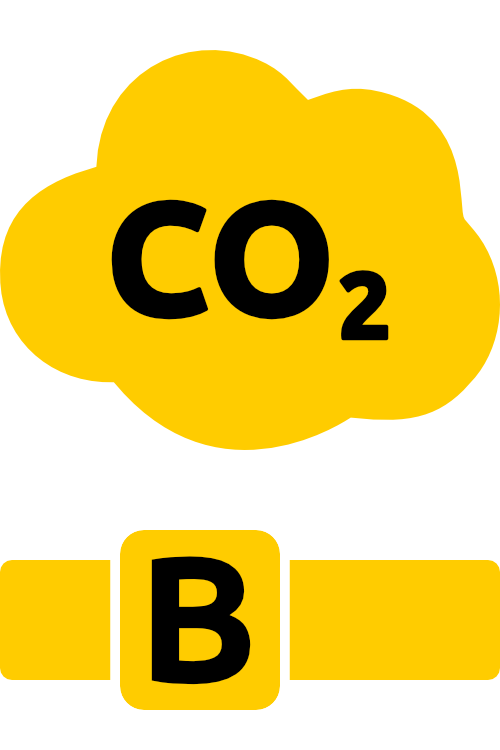
Better than average – on the way to climate-friendly
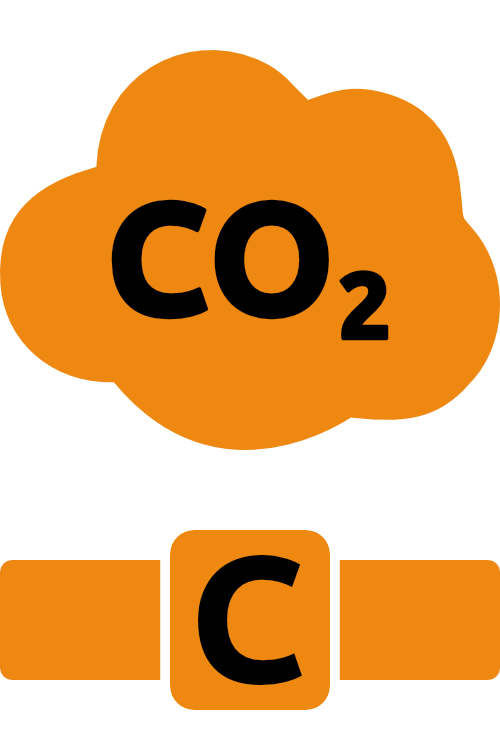
roughly in the average range – neither particularly good nor particularly bad
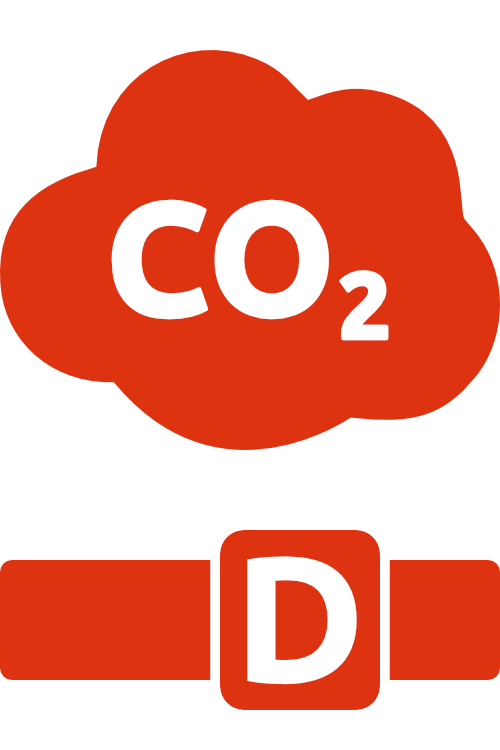
Increased CO₂ emissions – well above average
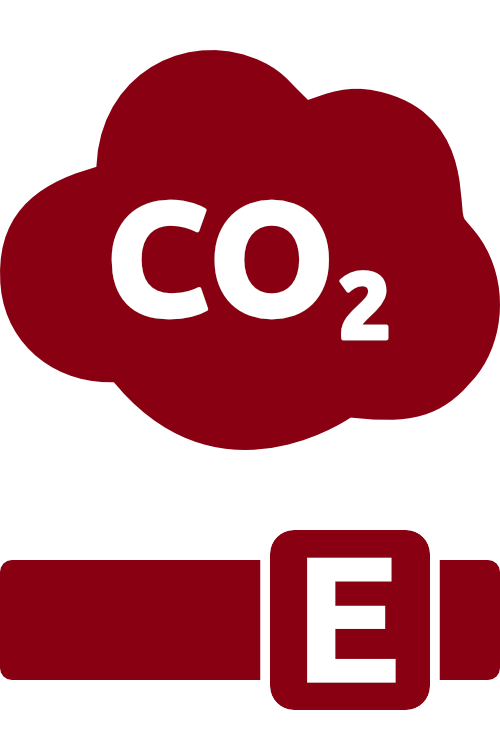
in the worst 10 % range – very high CO₂ emissions
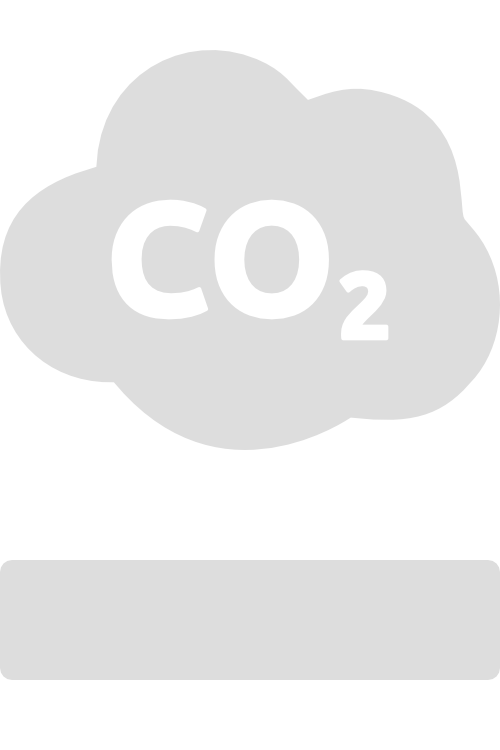
There are no reliable calculation values for this dish yet
1.1 CO₂ footprint
The CO₂ footprint indicates how many CO₂ equivalents (CO₂eq.) are generated during the production of a dish – including all emissions from the production to the processing of a food product. CO₂eq. is a unit of measurement that converts all relevant greenhouse gases (e.g. methane, nitrous oxide) to a common basis – based on a period of 100 years.
1.2 Daily Food Unit (satiety index)
This shows how well a dish contributes to meeting the daily nutritional requirements of an average person for a climate-friendly diet. Protein, fat, water, energy content and dry matter are included in the assessment (based on the German Nutrition Society).
1.3 How the evaluation is carried out
Both factors (carbon footprint and daily food unit) are calculated (normalized) for the assessment. This step means that the climate labeling is independent of the portion size. For example, a dish with a high nutrient content and a low carbon footprint receives an “A”. Two dishes with the same carbon footprint can be rated differently if their nutrient composition differs.
The number of grams next to the dish indicates the CO2 footprint based on the portion size that was taken into account in the assessment. Only then is the calculation (standardization) carried out with the nutritional values for the assessment of the climate label. The calculations are based on over 70,000 comparative meals from the Eaternity database, one of the largest databases worldwide for CO₂eq. calculations in the food sector. It was developed in collaboration with researchers from the ZHAW, University of Zurich, ETH Zurich, FiBL, Quantis and other scientific institutions.
To summarize:
- The more nutrients with a low carbon footprint, the better the climate rating.
- Two dishes with the same CO₂ footprint can have different ratings (e.g. green vs. yellow cloud), depending on their nutritional values.
- The number of grams of CO₂eq under the dish shows the absolute emissions of the dish, which are then offset against the nutritional values.
2) Water footprint
The water consumption symbol (water drop) shows the amount of water required to produce a dish and sets this value in relation to the average of all analyzed dishes. Both the direct water consumption and the availability of water in the respective region are decisive here. Sustainable use of water can help to reduce dependence on scarce resources by 50 %[3].
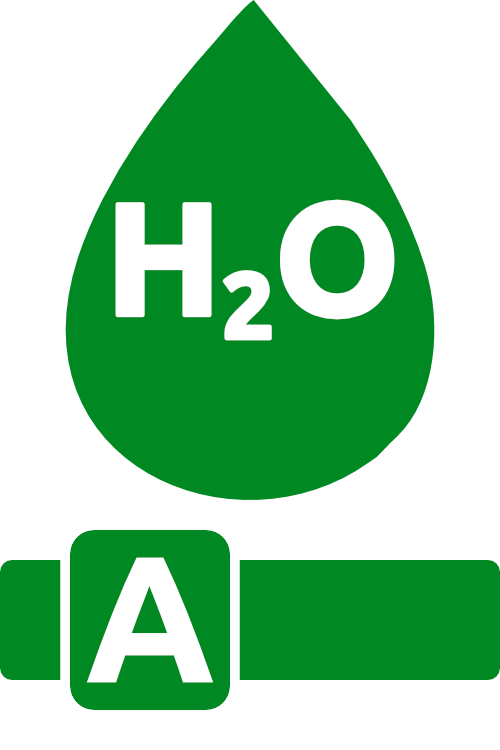
Very gentle on water, very low water consumption
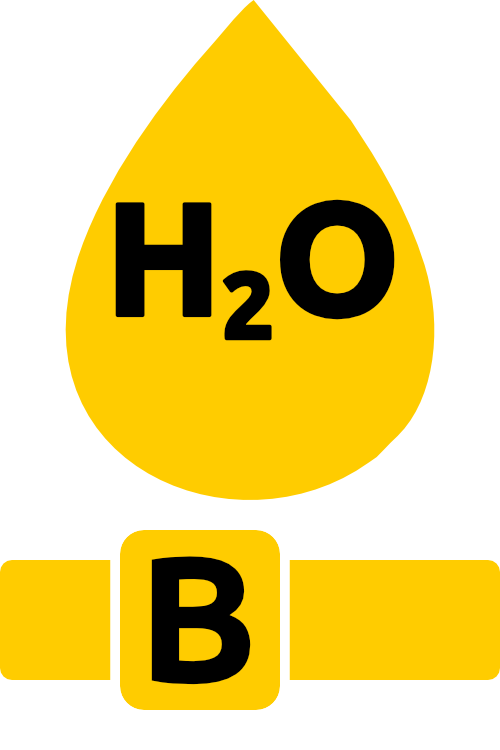
Sustainable water consumption
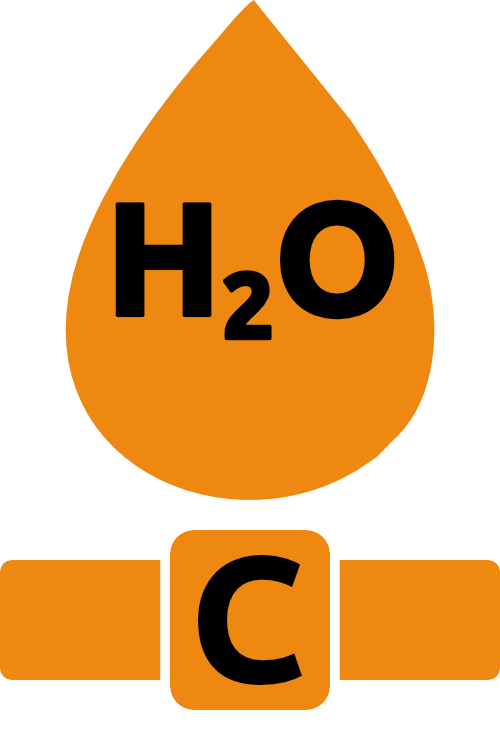
approximately average water consumption
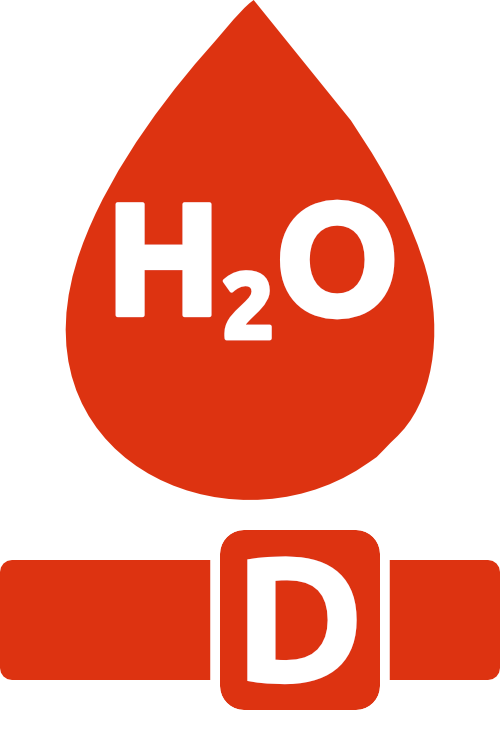
Increased water consumption
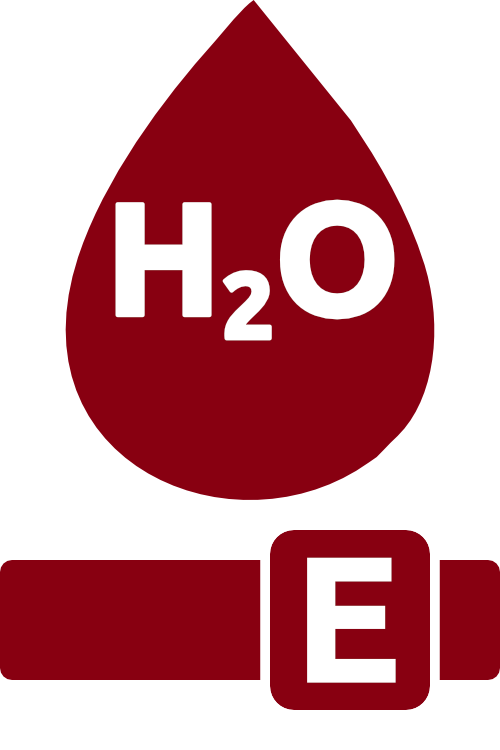
Very high water consumption
There are no reliable calculation values for this dish yet
These labels were developed and inserted in cooperation with the BMBF project KlimaPlanReal.
